Overview
We know teams are busy, so in this doc we’ve aggregated what we feel is the most important information you need to get from 0 → 60 with SourceMedium in Looker Studio. However, if you have the time, we do recommend checking out Looker Studio’s quick-start guide here – or, if you’re more of a visual learner, this 20 minute crash courseGlossary
Glossary
Report
Report
Connector / Data Source
Connector / Data Source
Component
Component
Field
Field
- Dimensions are things that you want to measure, or that serve as ways to categorize your data.
- Metrics are numbers that measure the things that are contained in dimensions.
View Mode / Edit Mode
View Mode / Edit Mode
- People who can edit a report or data source are referred to as editors.
- People who can only view a report or data source are referred to as viewers.
Credentials
Credentials
SourceMedium’s Looker Studio templates
If you’re on our Managed Data Warehouse solution, SourceMedium provides a suite of template reports and data sources for your business to leverage out-of-the-box. Learn how to use our Looker Studio templates here, or checkout our template directories:Creating & Editing Data Sources
Data sources are your report’s connection to data that is stored somewhere — for example your SourceMedium warehouse, a Google Sheet, Google Analytics etc.Creating new data sources
Creating new data sources
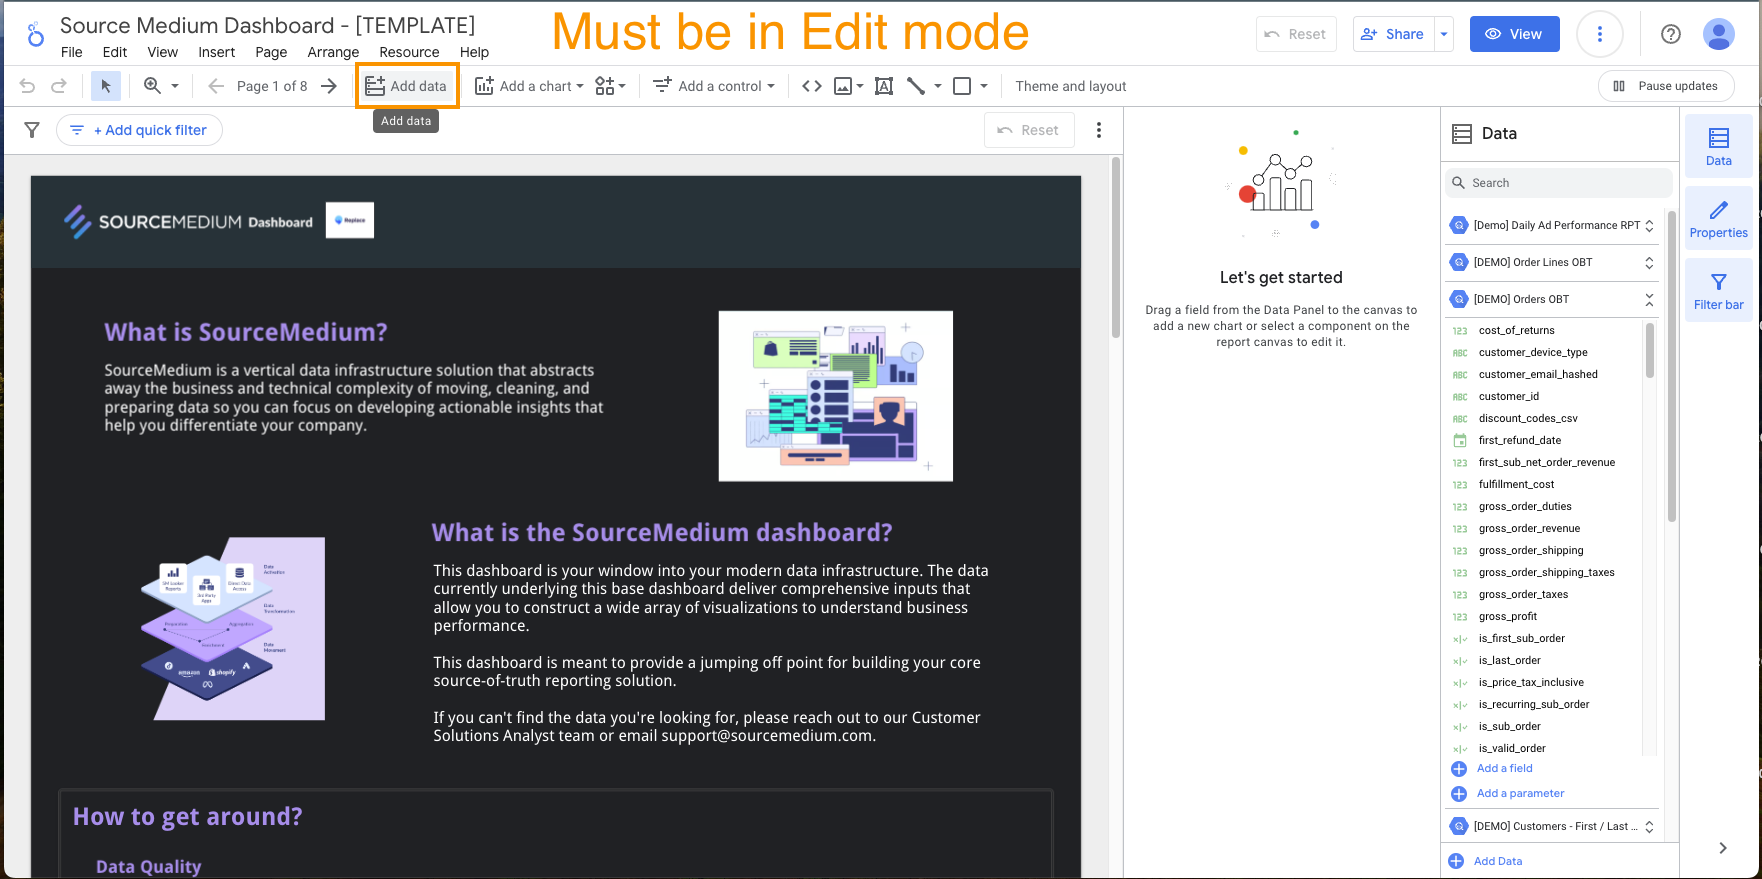
obt_orders. You can also write your own queries to derive new tables based on tables within your warehouse.The majority of your data source creation needs will be enabled via data coming from your BigQuery warehouse — using the Looker Studio BigQuery connection — so that’s what we’ll focus on in this tutorial.You can create new data sources directly from your report, or from your Looker Studio home page. The steps for configuring your new data source will be the same, regardless of where you initiate the creation process.Create new data source from your report (must be in Edit mode)
Create new data source from your report (must be in Edit mode)
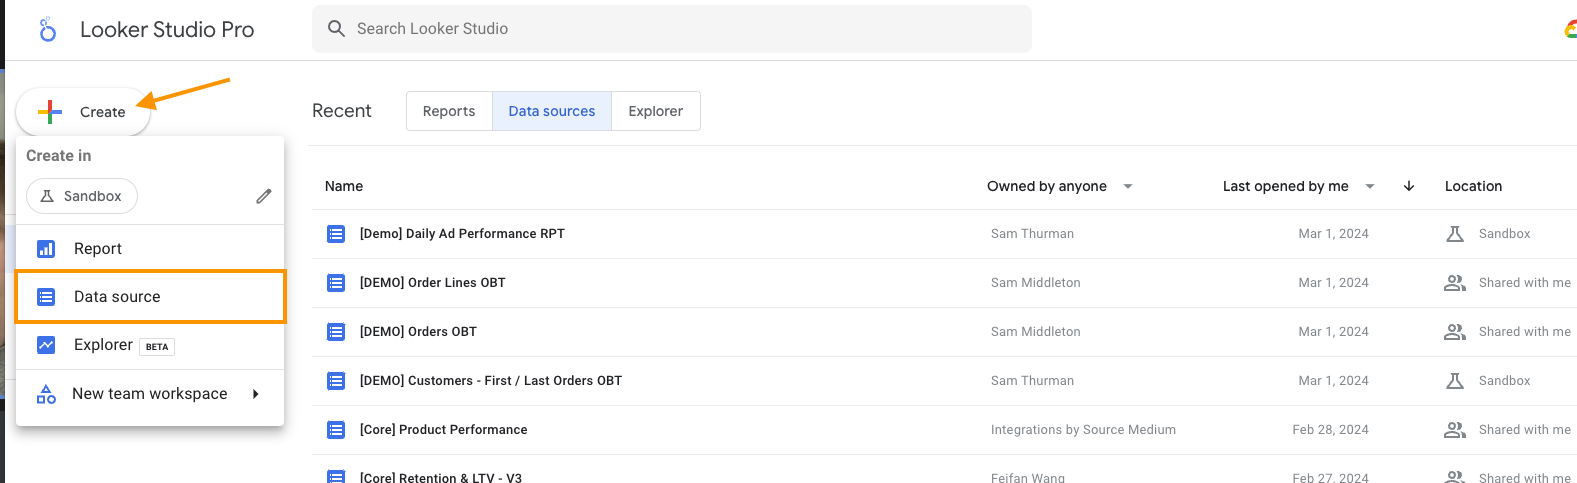
Create new data source from Looker Studio home page
Create new data source from Looker Studio home page
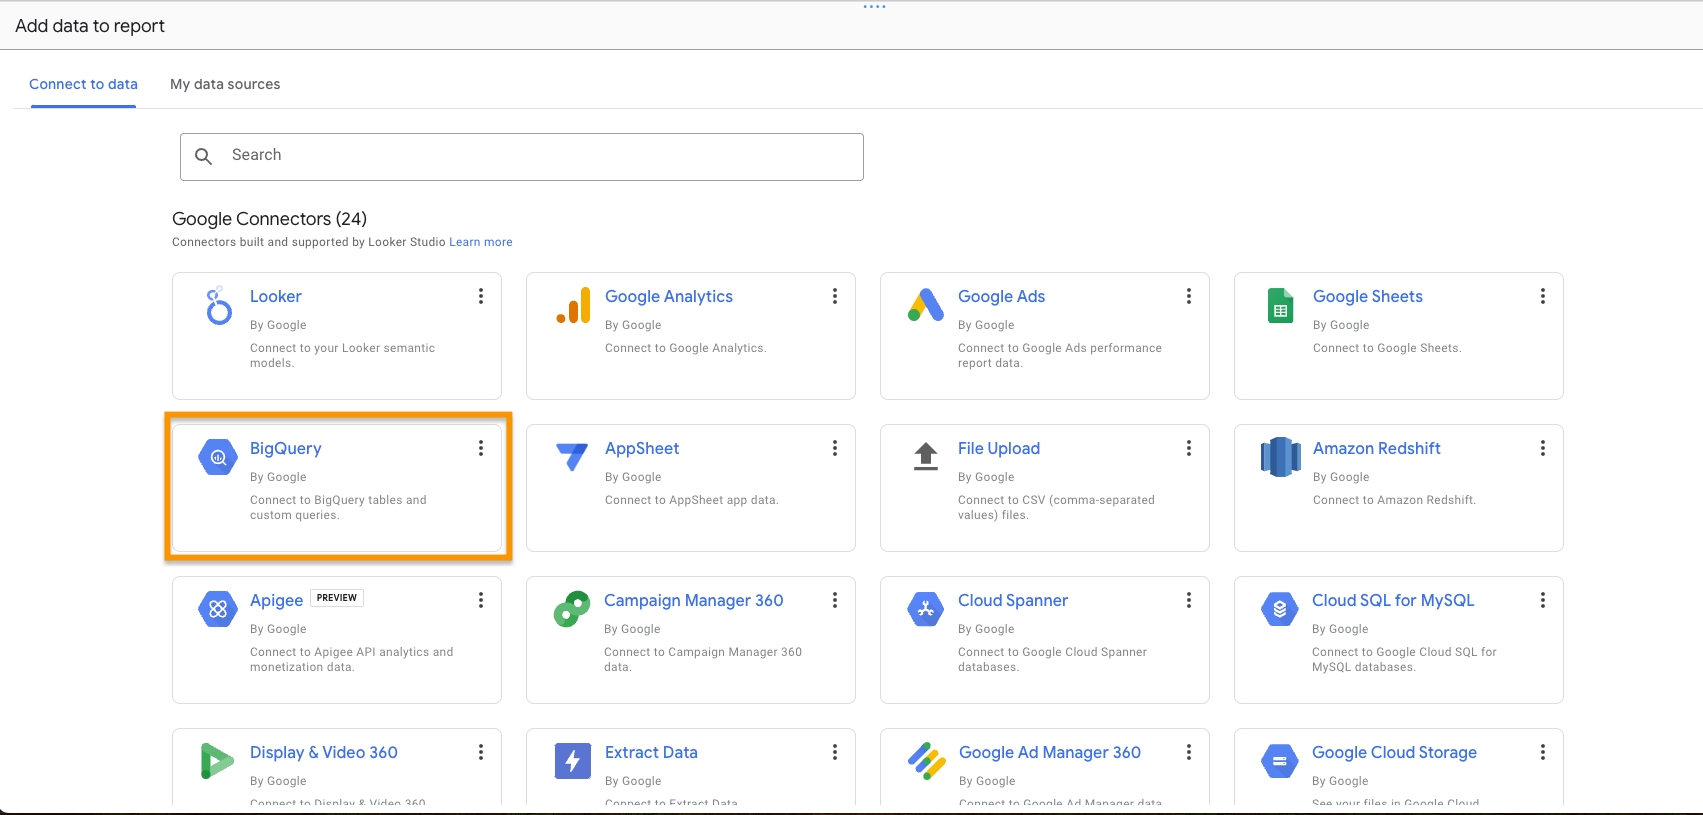
1. Start by selecting the BigQuery connector
1. Start by selecting the BigQuery connector
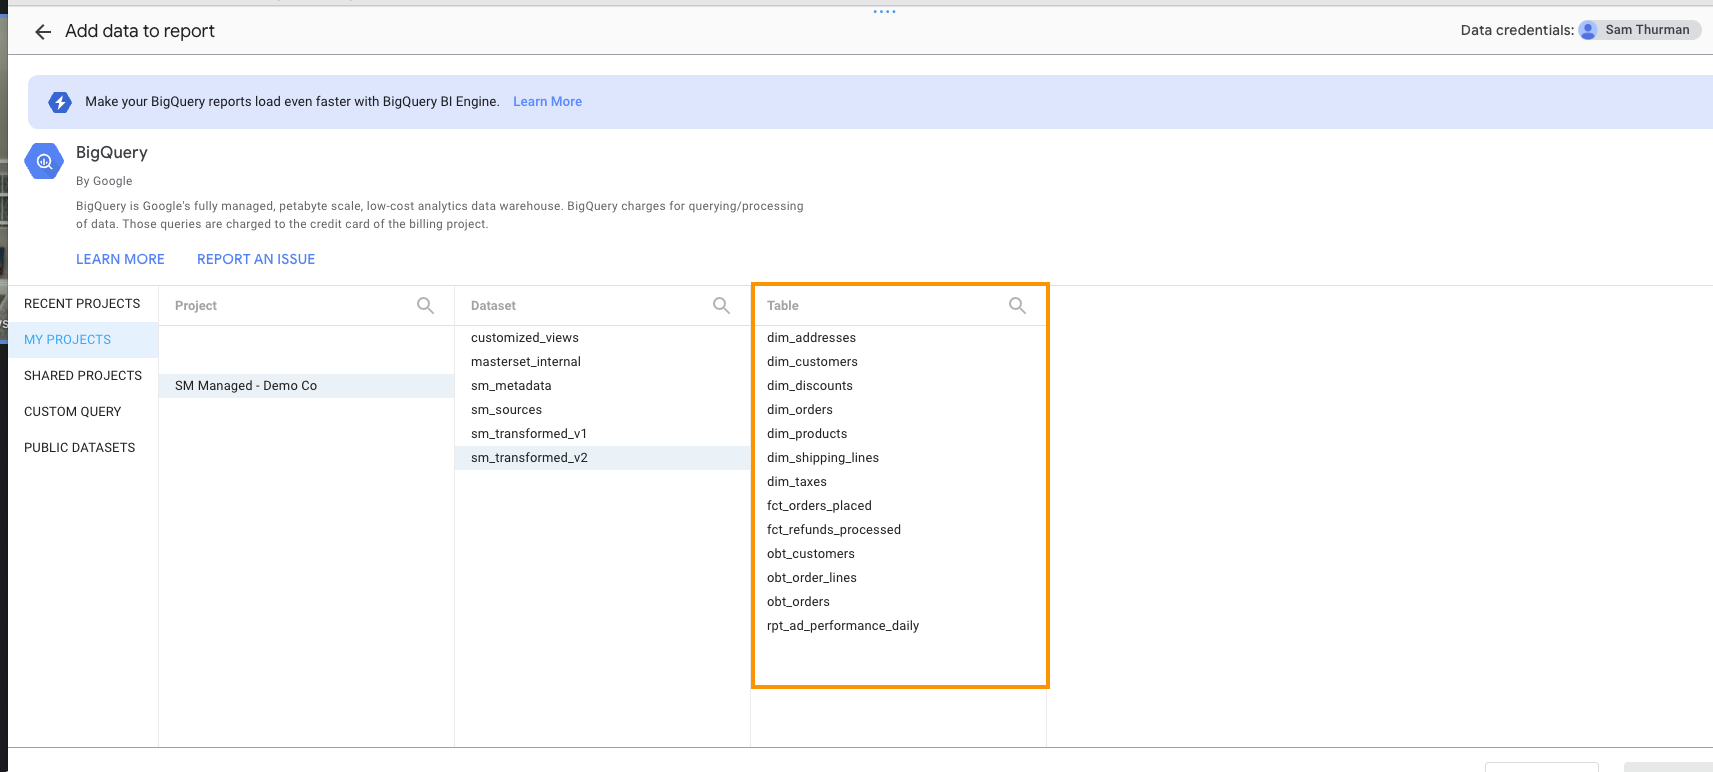
2. Select a specific table, or create your own custom query
2. Select a specific table, or create your own custom query
Existing table from BQ
Existing table from BQ
- Under My Projects, select your SM managed warehouse (or other warehouse, no limits).
- Then select a corresponding Dataset and Table.
- Finally, press Add to create the data source
- For additional information on the Datasets & Tables available from SM and their utilities, visit here.
Screenshot
Screenshot
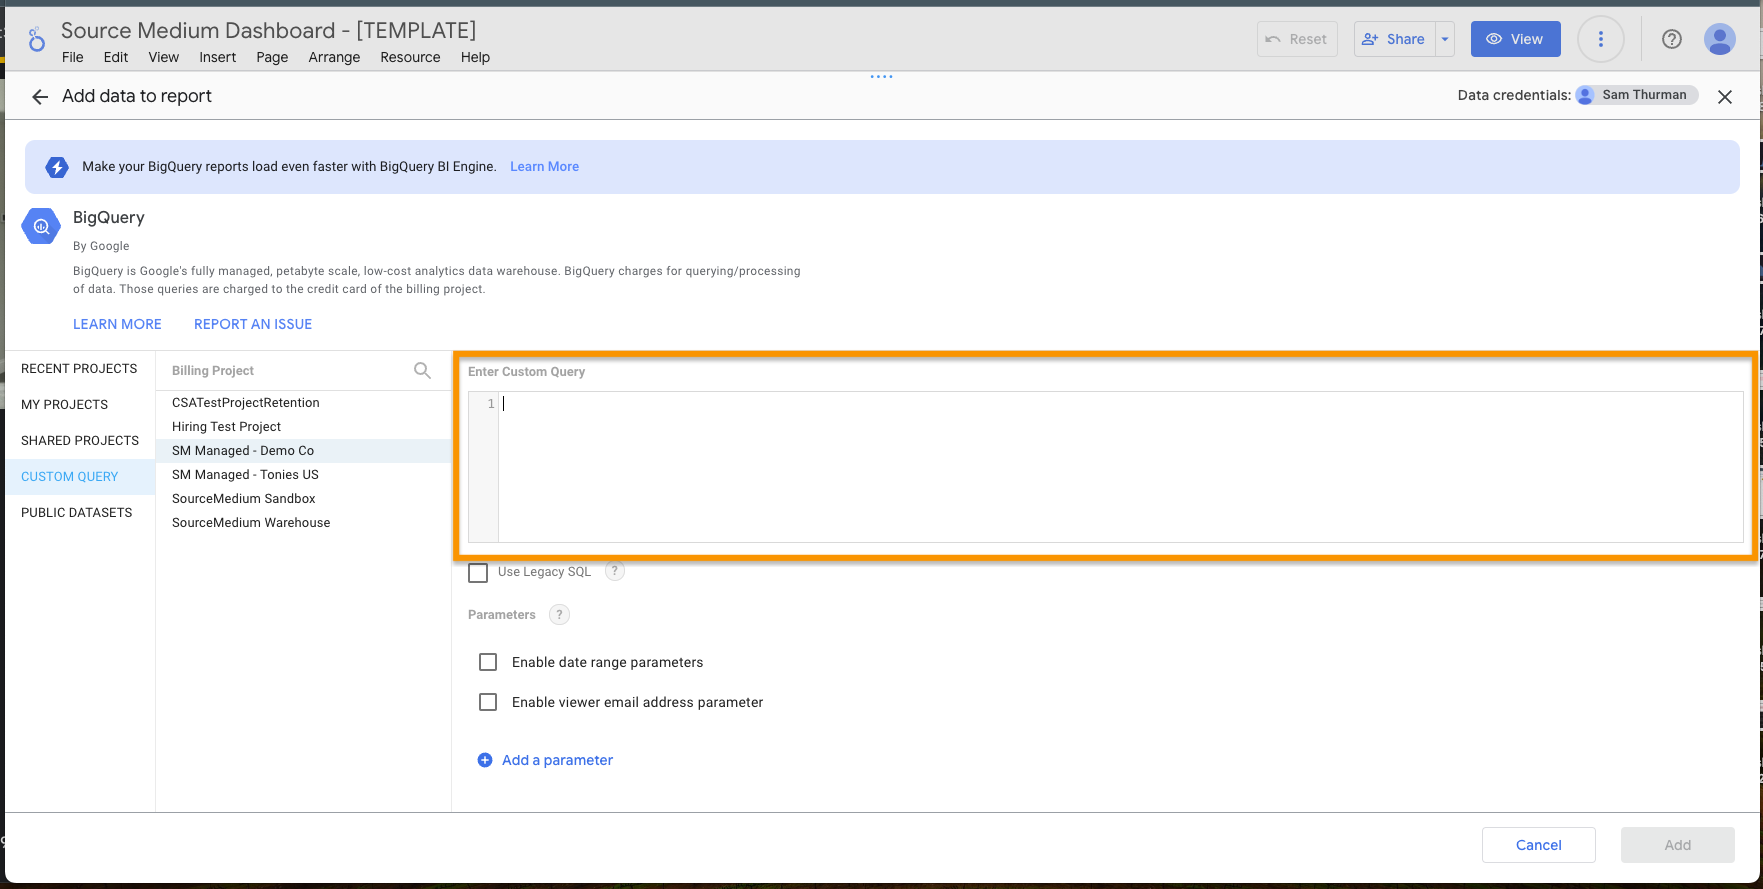
Custom SQL Query
Custom SQL Query
- Select Custom Query from the left menu, then select your SM-managed warehouse under Projects
- You can now write your query to pull data into the Custom Query box
- When done, press Add to create the data source
Screenshot
Screenshot
3. Rename your new data source, add access for team members, and start getting your hands dirty!
3. Rename your new data source, add access for team members, and start getting your hands dirty!
Data source hygiene & best practices section for more details!- By default, the account used to create the data source will automatically be assigned as the Data Credentials for that source
- You can change the Data Credentials for a data source at any time
- We recommend creating a service account to use as the Data Credential for all of your brand’s managed data sources
- Additional documentation on data credentials
Data source hygiene & best practices
Data source hygiene & best practices
- Data Source Naming
- We highly recommend having the Data Source name explain the underlying table / data it’s referenceing
- e.g. if you were to provision your own copy of our [DEMO] Orders OBT table, we’d recommend naming it
Orders OBT,Orders,[MyBrand] Orders OBTetc
- e.g. if you were to provision your own copy of our [DEMO] Orders OBT table, we’d recommend naming it
- We highly recommend having the Data Source name explain the underlying table / data it’s referenceing
- Field Naming & Field Descriptions
- When creating a new data source from BigQuery, you’ll notice computer-friendly field names containing words separated by underscores. These are the field names as they exist in your warehouse (you can look up field definitions using this field name in our Metric & Dimension documentation)
- We encourage you to rename fields in whatever format is easiest for your team to understand!
- If you do decide to rename fields, we very strongly encourage you to copy the original field name into the Description field, as is this is the only reference you’ll have to the original field name (in case of needing to look up definitions etc.)
- For calculated fields, we recommend including the definition in the Description field
- Data Source Viewers don’t have access to examine underlying logic for calculated fields, so it’s good for all-team visibility to have that logic defined in the field Description.
- If you’ve made personal duplicates of one of SourceMedium’s template data sources, you’ll notice that we’ve already renamed fields and mapped their warehouse name in the Description field
- Please do not edit the Description field on these data sources
- Data Source Access & Permissions
- See
Sharing access with your teamsection at the bottom of this article
- See
Creating & Editing Reports
Reports allow you to visualize your data, making it digestible for teams and stakeholders.Creating reports from scratch
Creating reports from scratch
-
Log in to https://lookerstudio.google.com/
- Here you’ll be able to see all of the reports & data sources that you have access to.
-
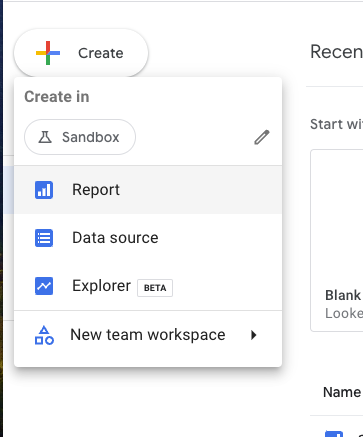
Near the top-right of the page, find and click the
+ Createbutton, and then selectReport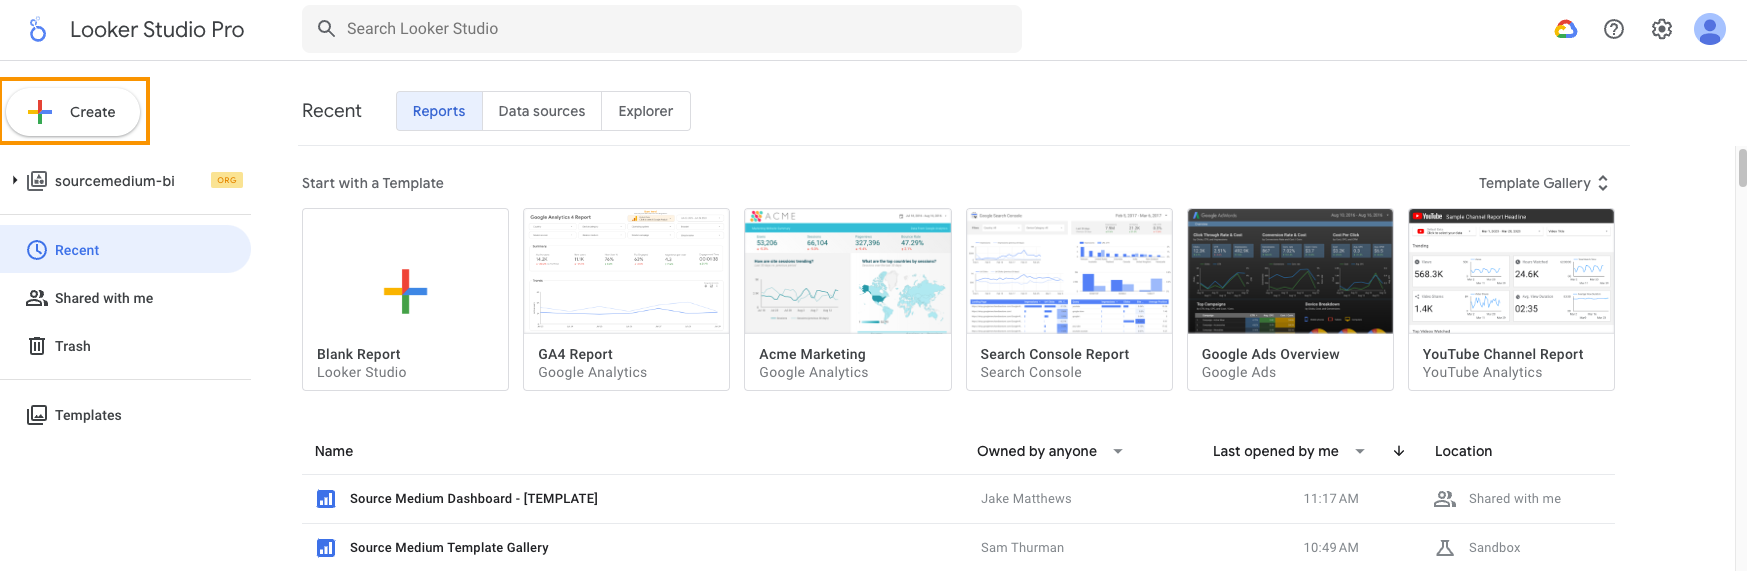 \
\
-
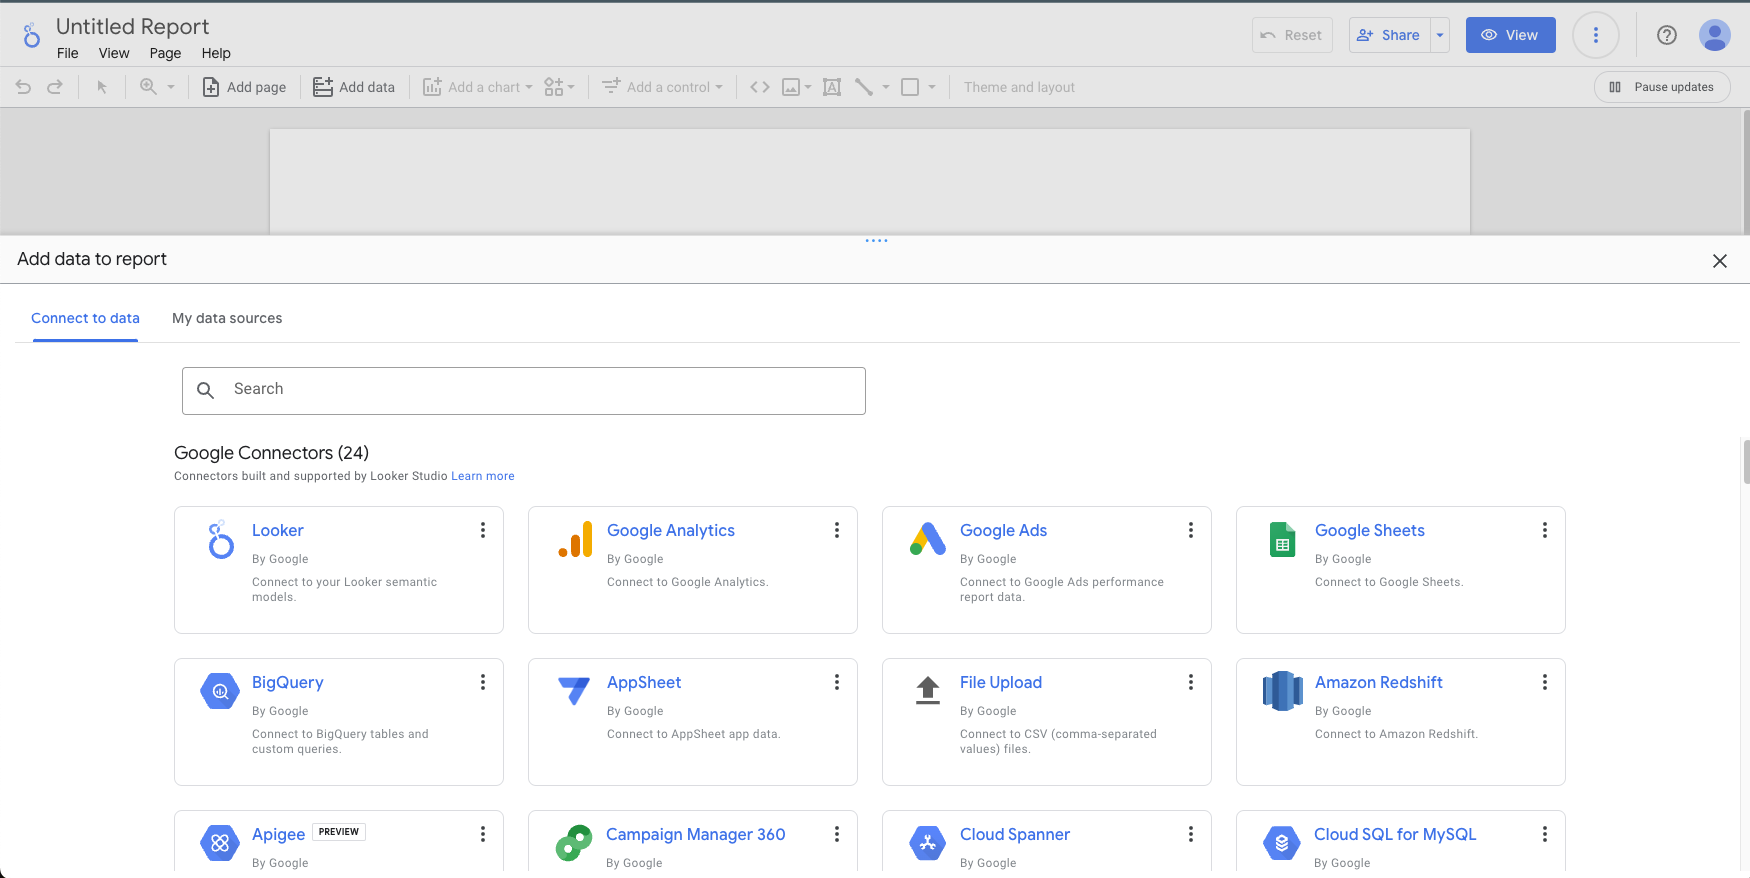
You’ll immediately be moved to a blank report, and asked to select data to add to the report
Details
- If have already existing data sources you’d like to connect, navigate to the My data sources tab and select a source to include
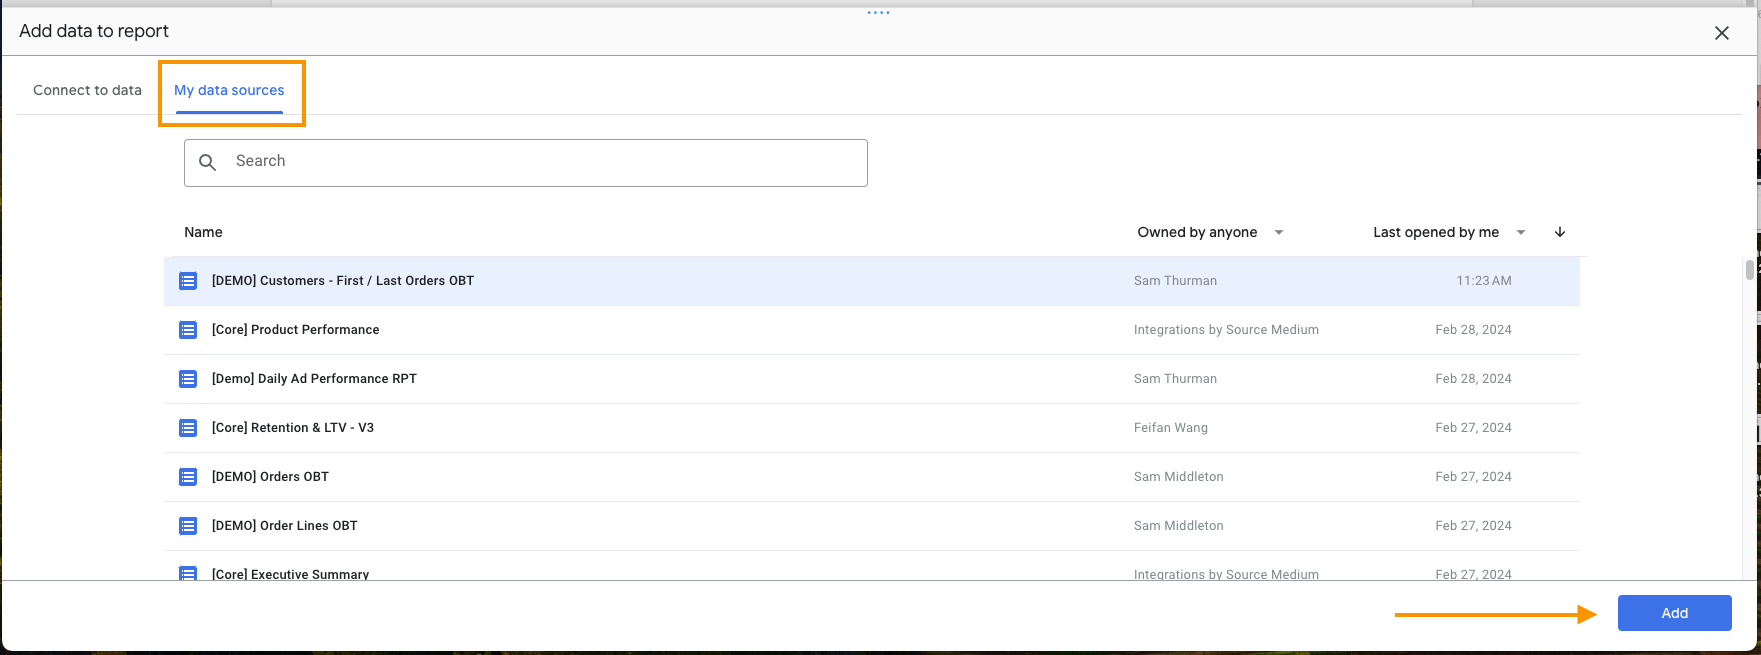
- You can only select 1 data source in this step, but you can always add more later
- If you’d like to create a new data source from data in your data warehouse, select the BigQuery connector and set up your new data source
- If connecting a Looker-native data source (Google Ads, GA4, Search Console etc), simply select the connector, follow the authorization instructions, and select the account / view to connect
- If have already existing data sources you’d like to connect, navigate to the My data sources tab and select a source to include
- Once you select an initial data source to add, you’ll be able to rename (recommended to do this right away) and begin editing the report!
Editing reports
Editing reports
Dates & date range controls
Dates & date range controls
- About date range controls & how to add them to your report
Add additional data sources
Add additional data sources
- From the top navigation bar, select Resource → Manage added data sources
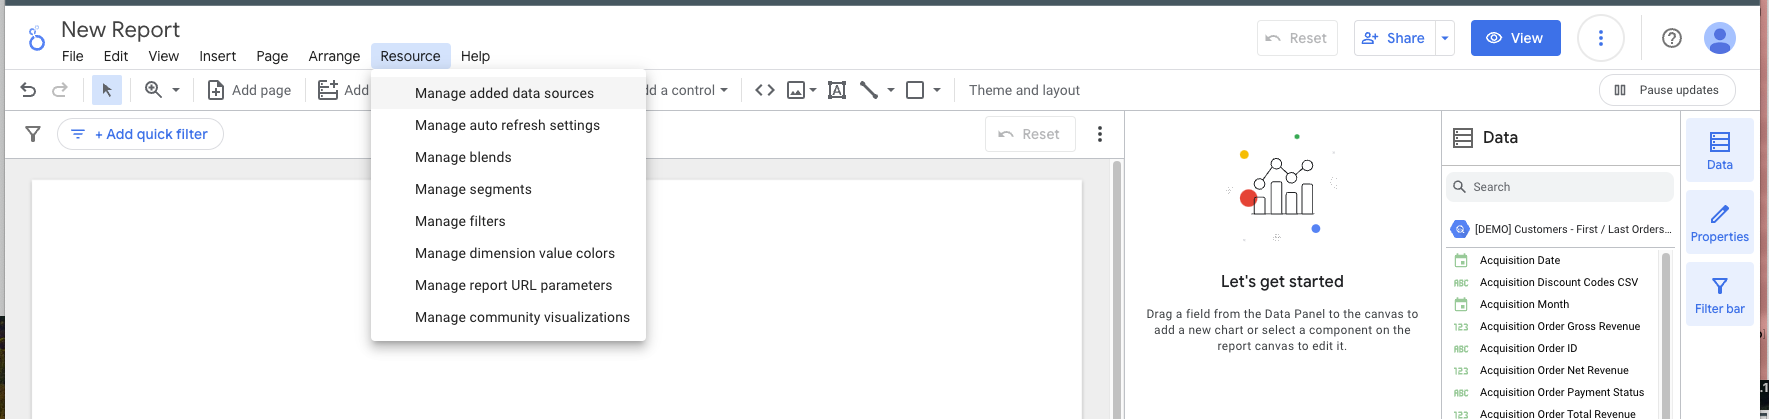
- Here, you’ll be able to view all data sources that have been added to your report
- Select
Add a Data Source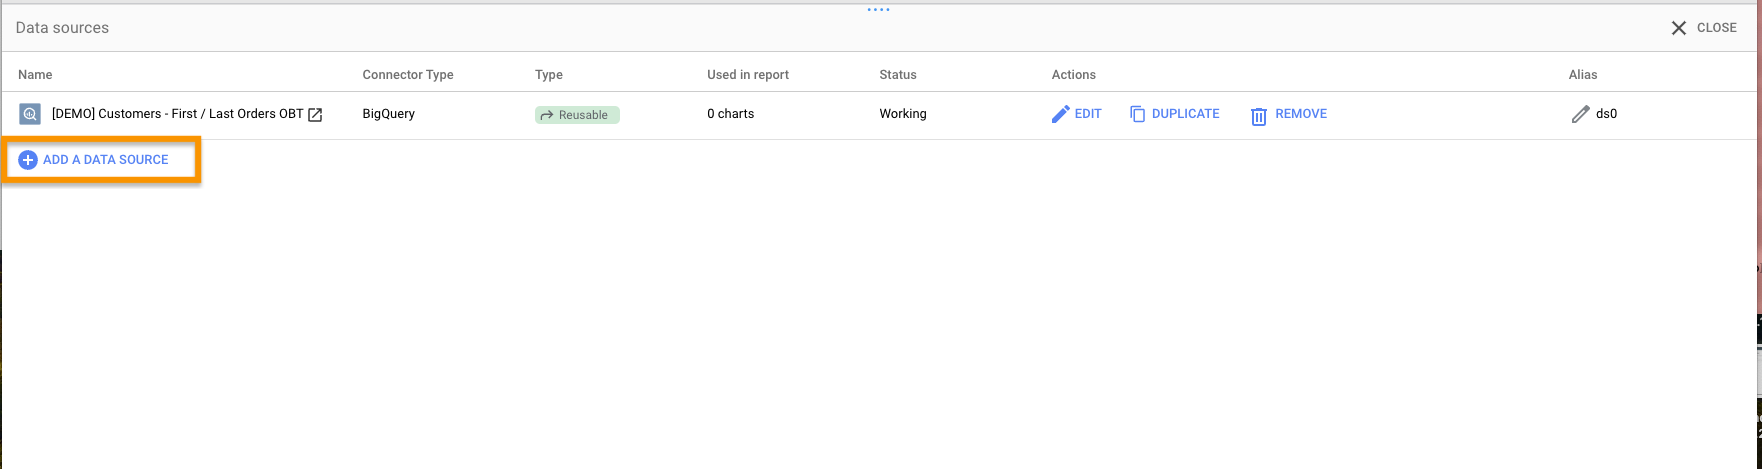
- You’ll be greeted with the same window you encountered when creating the report, asking you to select the type of data source you’d like to connect
- Work through the connector-specific steps
Visualize your data
Visualize your data
Creating charts
Creating charts
-
Within the top nav-bar, select
Add a chart, and select the chart-type you’d like to use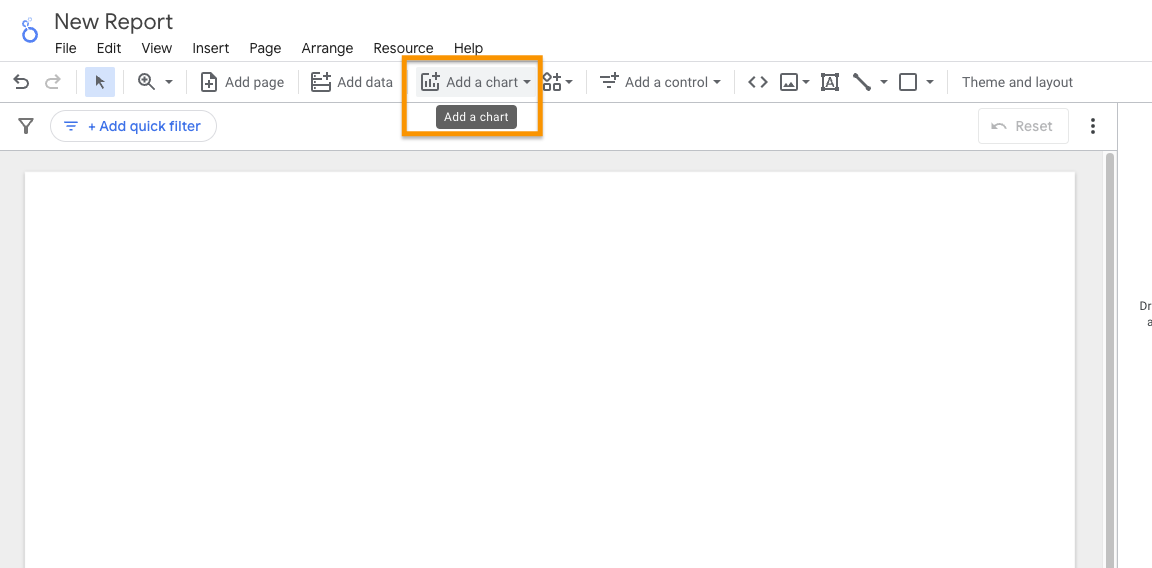
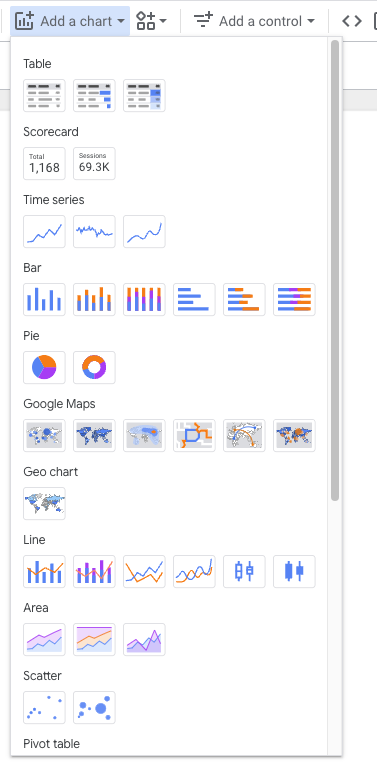
- See here for additional information from Google on the available Looker Studio chart types
-
Drag and drop the chart to the desired location on-page
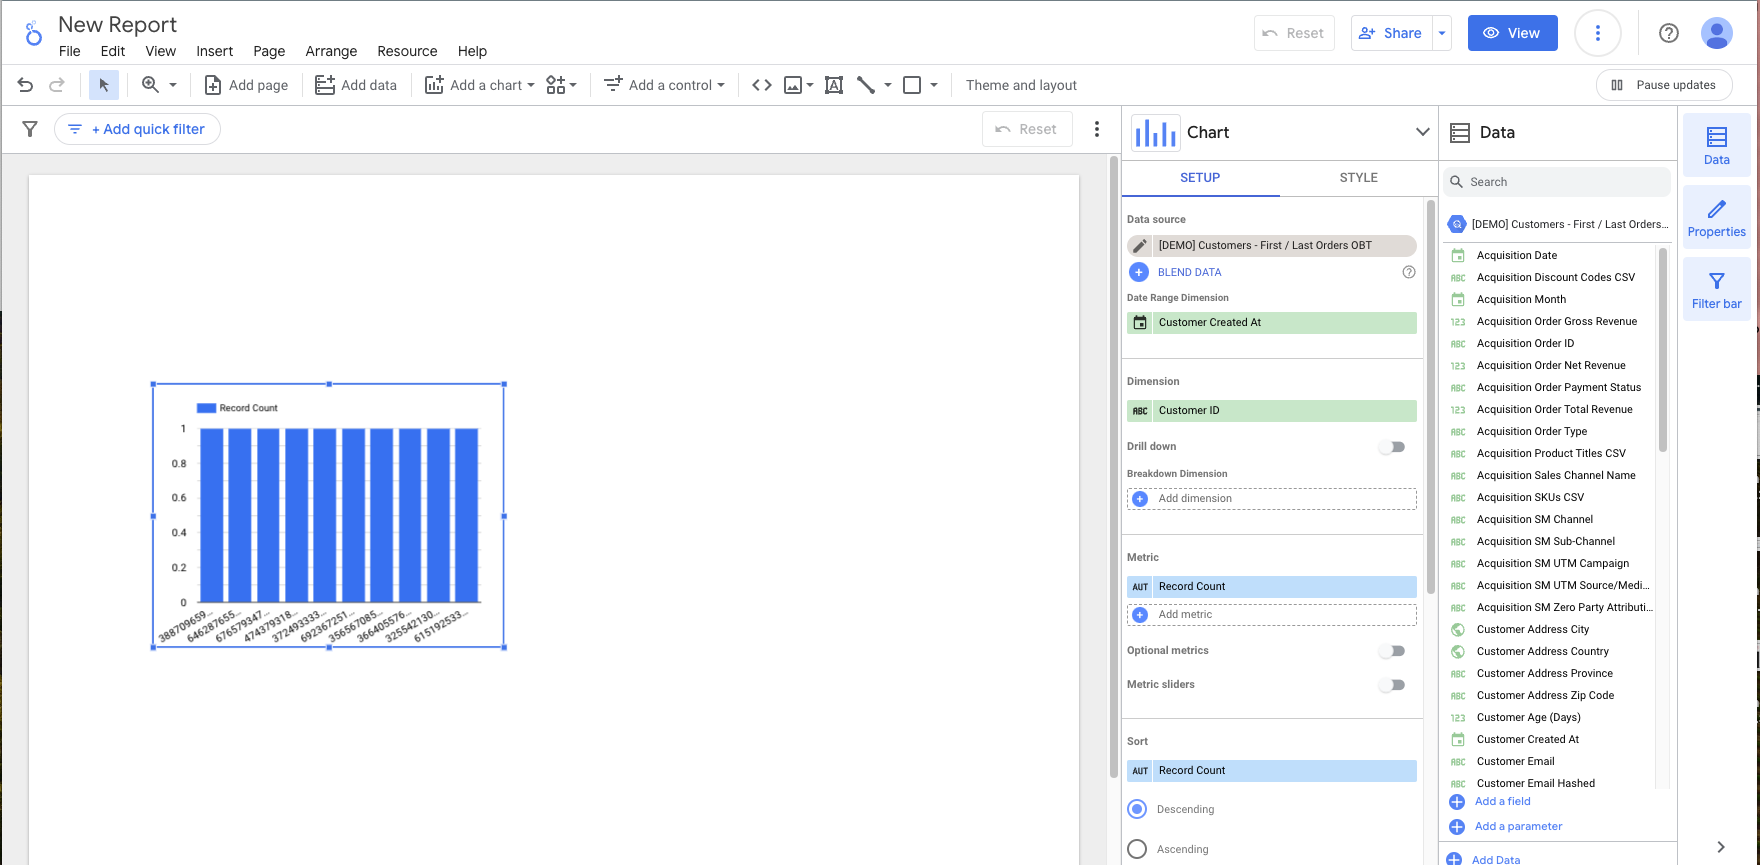
-
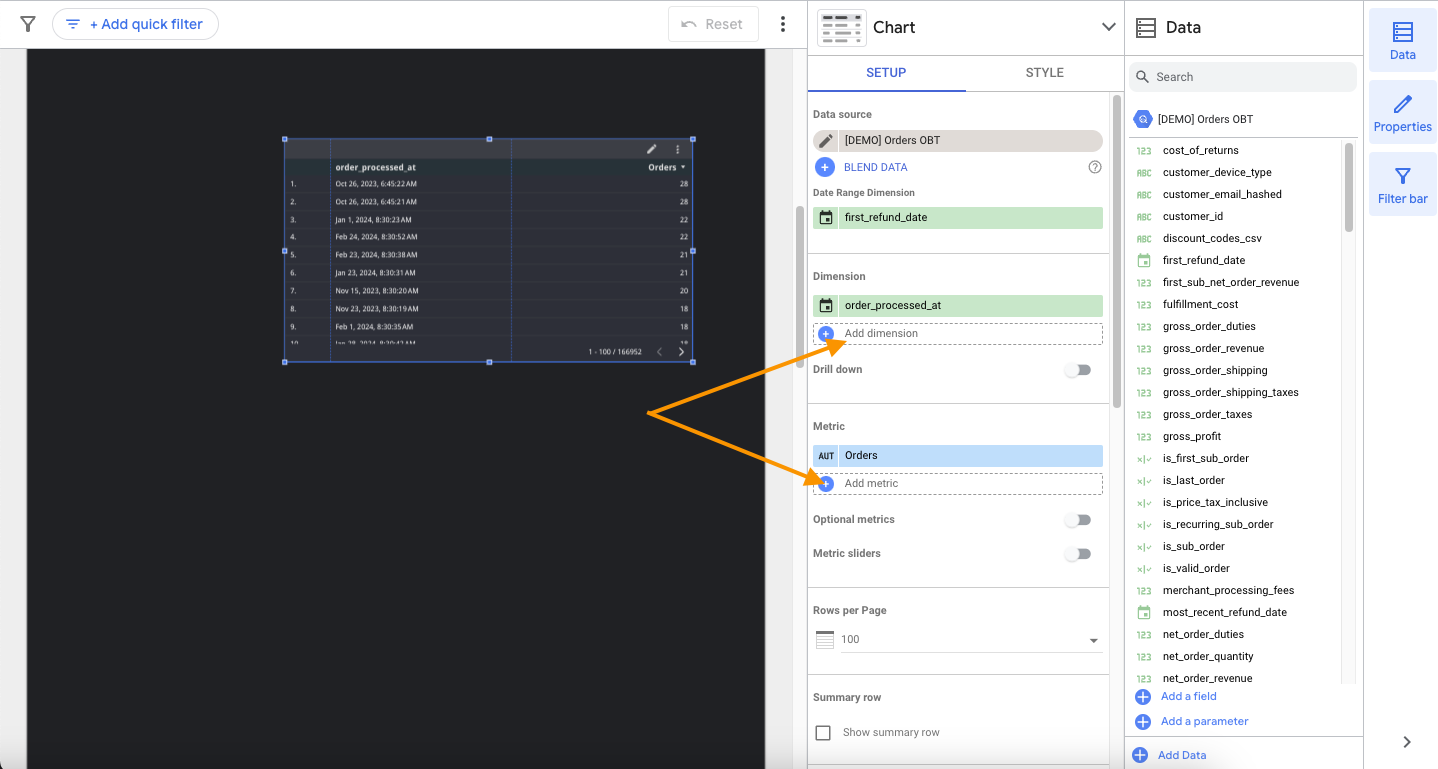
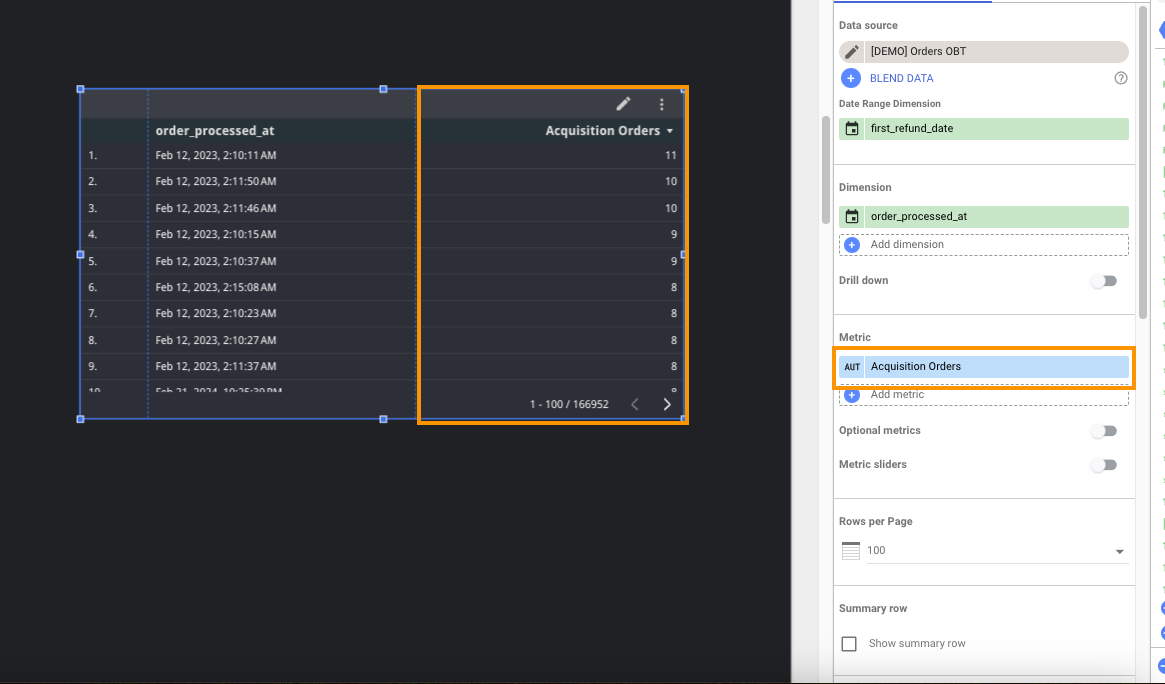
You can now swap in the metric(s) and dimension(s) you wish to visualize!
You can do this by selecting new fields directly from the Chart → Setup panel
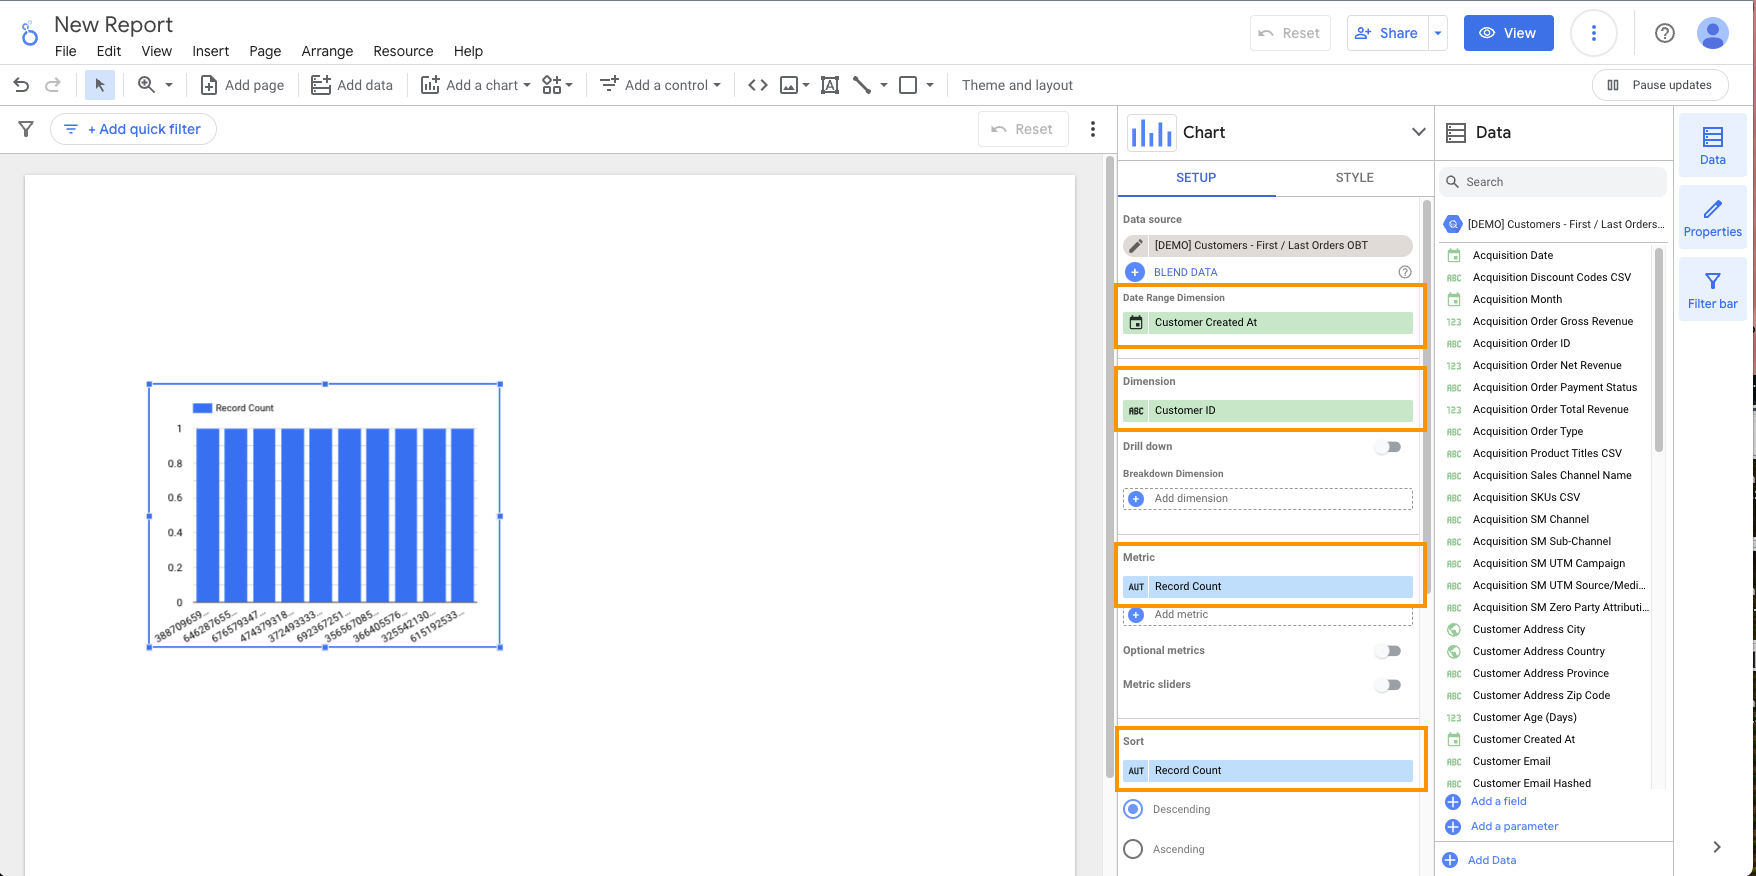
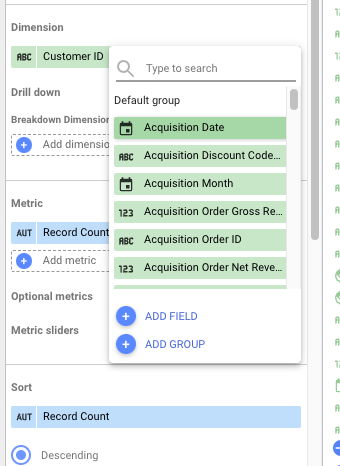
Or by drag & dropping fields from the Data panel to the Chart → Setup panel
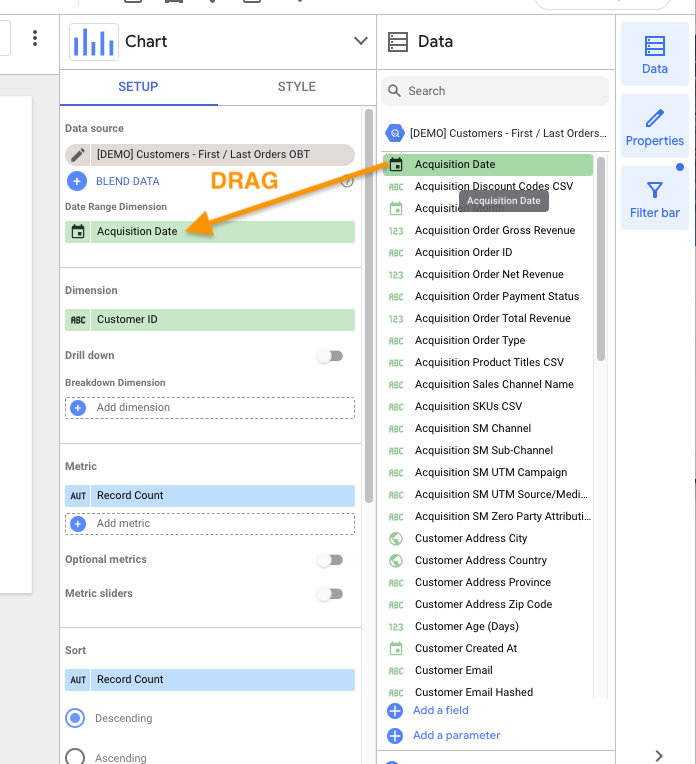
- Make sure to pay attention to the date range dimension, which is set on each chart
- You can find additional info on working with charts and tables here
Chart configuration & styling
Chart configuration & styling
- Configuring Looker Studio components
- Using the Properties panel
- Looker Studio chart types & styling tips
Filter your data
Filter your data
Control components - page-level components that allow report viewers to filter data themselves
Control components - page-level components that allow report viewers to filter data themselves
- Additional information on control components and how to add them to your report
Object-level filters - chart, page, or report-level logic that pre-filters all components within the given scope
Object-level filters - chart, page, or report-level logic that pre-filters all components within the given scope
Custom logic fields (”calculated fields”)
Custom logic fields (”calculated fields”)
Structuring your report
Structuring your report
Calculated fields — custom metrics & dimensions
Calculated fields allow you to use custom logic to create new metrics & dimensions based on your data without needing to drop into your data warehouse. You can either create calculated fields directly within a report component (chart, table, filter) — for temporary or more isolated use — or you can create calculated fields at the data source level for all users to use.Creating calculated fields within a report component
Creating calculated fields within a report component
- Select the chart or control component you’d like to add your new field to
-
Select Add Metric or Add Dimension, depending on the new field you’d like to create
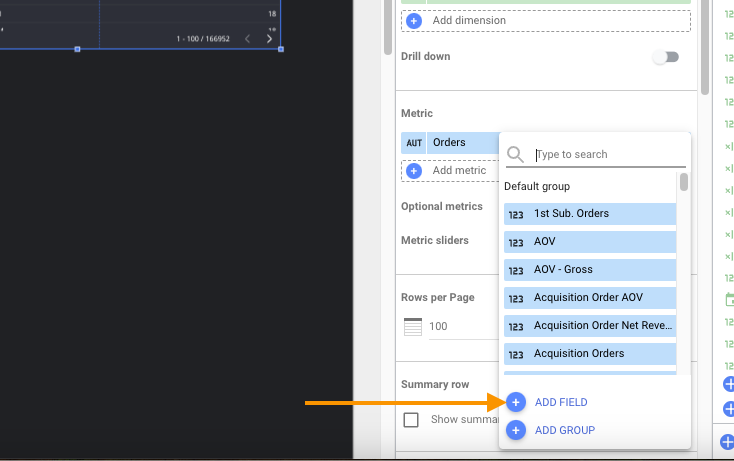
- You can also select an already existing field and choose Add Field to replace an already existing metric/dimension
-
An in-page window will open where you can name your new field and enter your custom logic
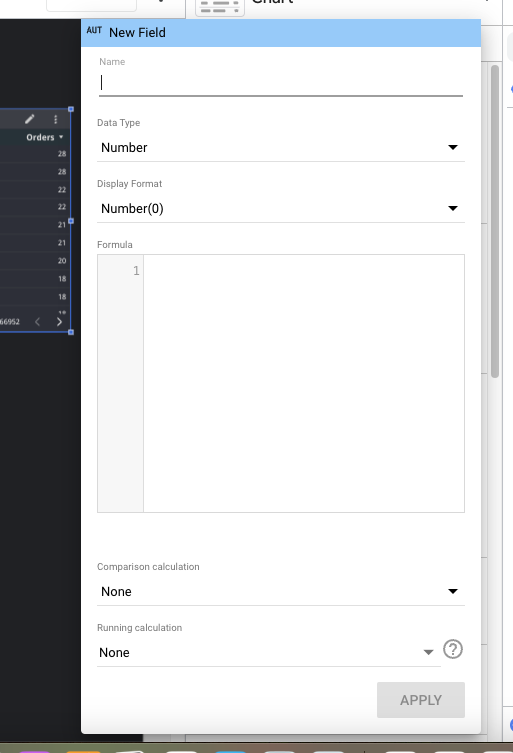
-
Once you’re satisfied with your new formula, press Apply
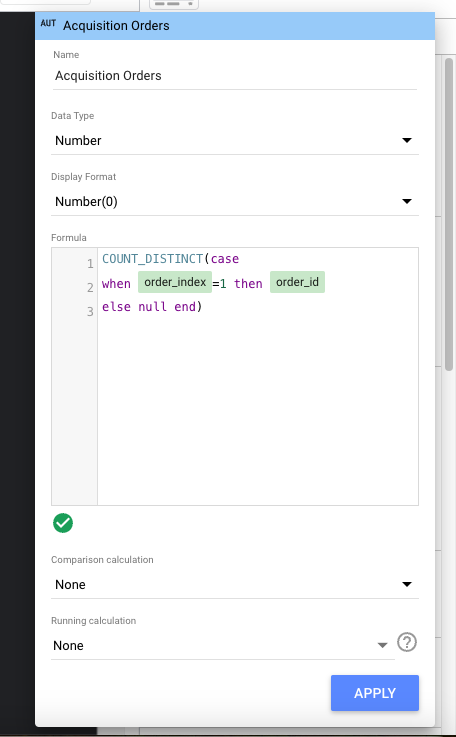
-
And you’re done! You can now see your new field within the chart configuration panel, and rendered on your chart
Creating calculated fields within a data source (must have data source Edit access)
Creating calculated fields within a data source (must have data source Edit access)
-
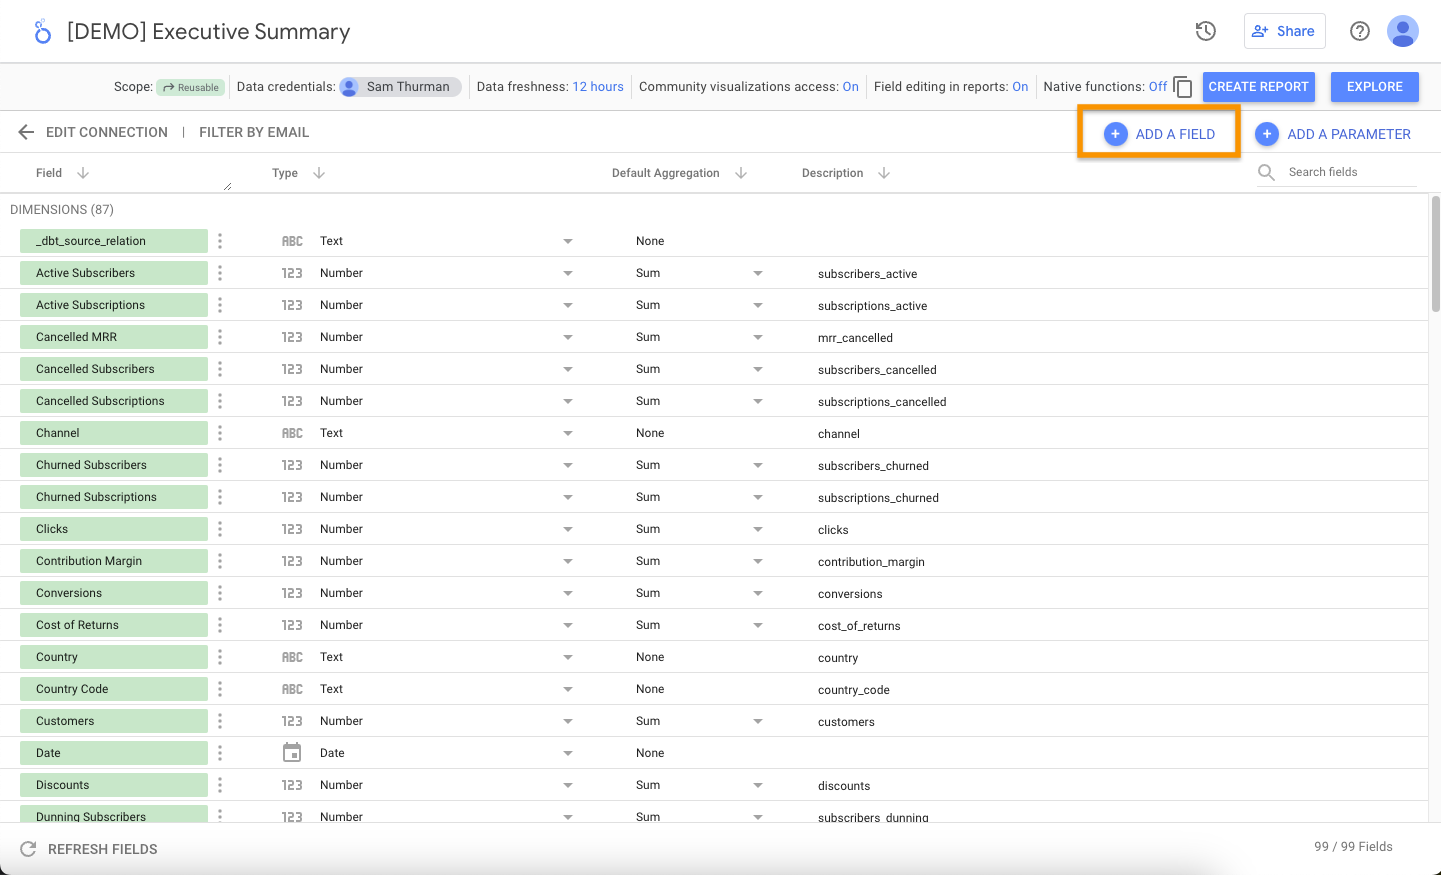
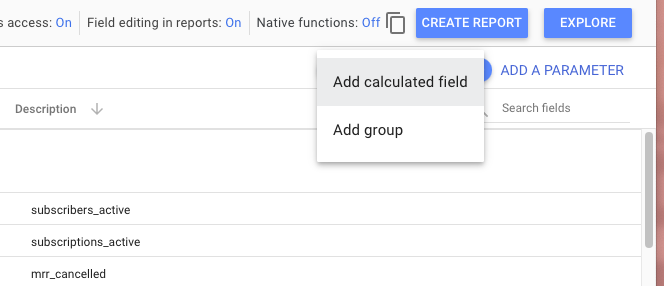
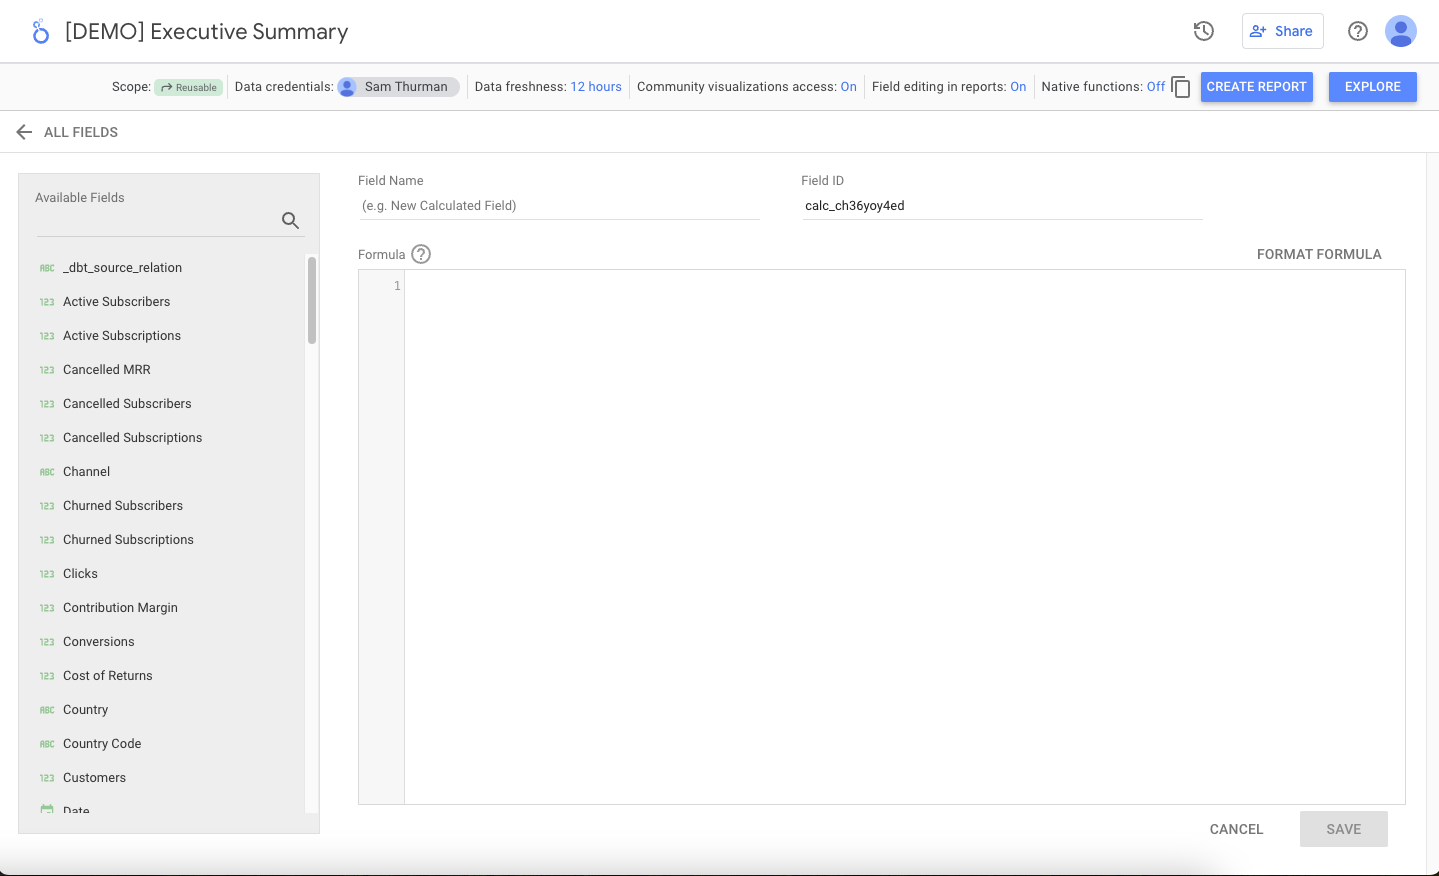
Open the data source you wish to create a calculated field on. Near the top-left of the view, select Add a field, and then select Add calculated field
-
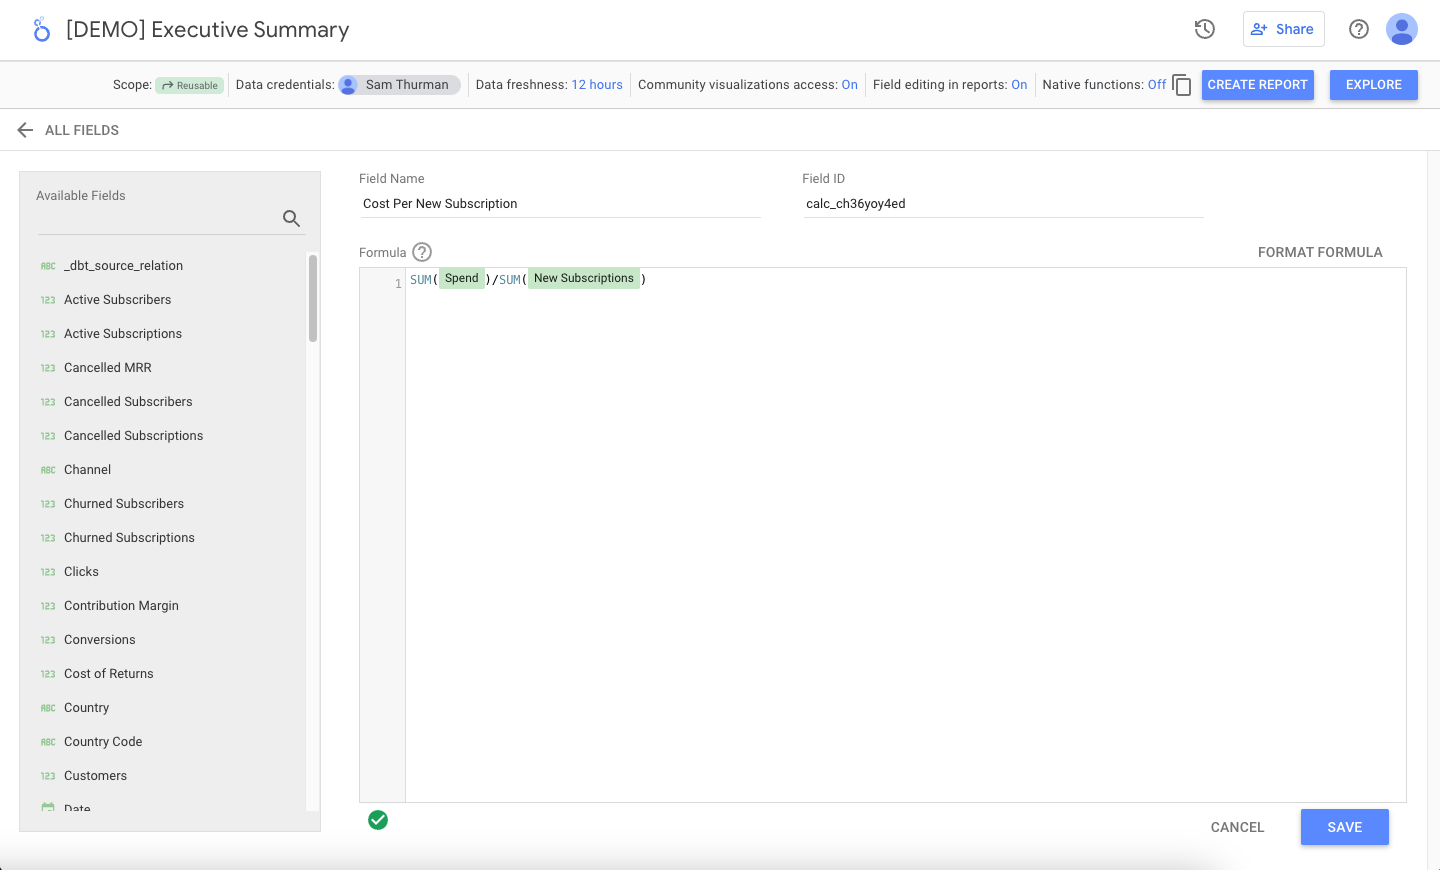
A new view will open where you can name your new field and enter your custom logic
-
Once you’re satisfied with your new formula, press Save
-
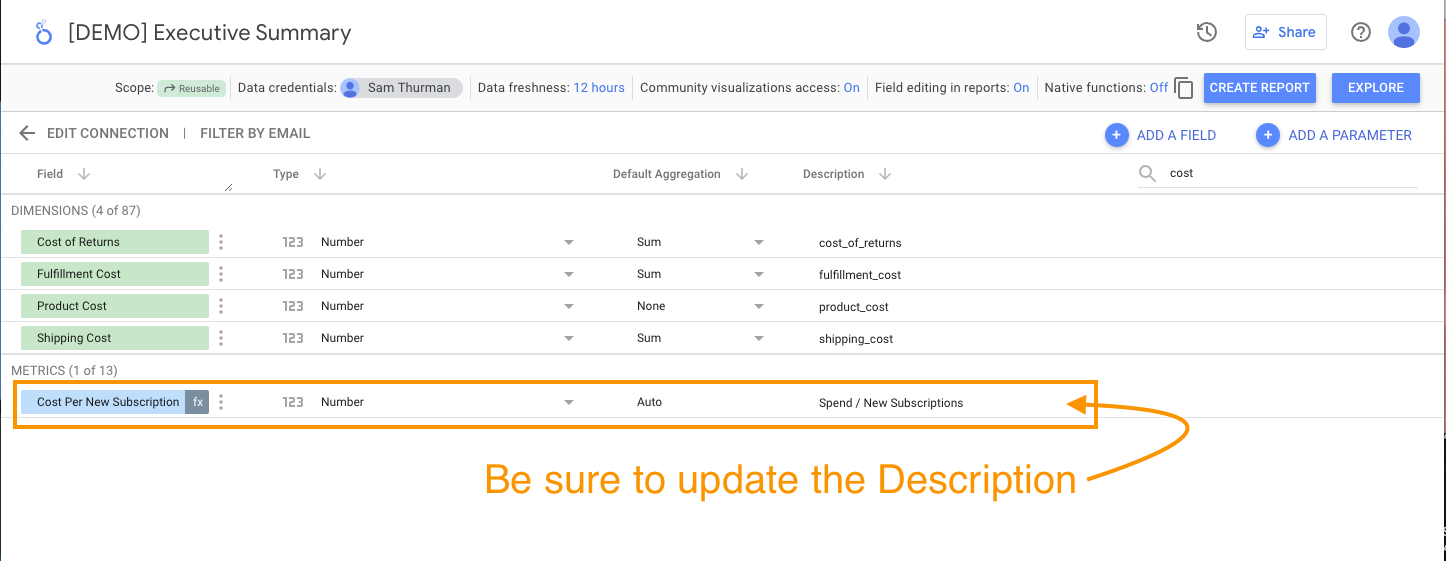
And you’re done! You can now see your new field within the data source, and it can be used within any report that your data source has been added to. Be sure to update the Description for the new field, so that data source Viewers have visibility.
Sharing access with your team
Report access
Report access
- Viewer — can simply view the report
- Editor — can view, and edit the report, and add access for other team mates
- Owner — can view, edit, and delete the report, and add access for other team mates
Data Source access
Data Source access
- Viewer — this user can look at the data source and all of the field descriptions
- Editor — this user can additionally rename fields & descriptions, edit the data source connection, and can create / edit / delete calculated fields. This user can also add view and edit access for other users
- Owner — this user can additionally delete the data source, and provision access to any user type (including changing ownership of the data source to a different user)
Leveraging Google Groups for permission management
Leveraging Google Groups for permission management
For example, here's one group structure that we've seen work for teams
For example, here's one group structure that we've seen work for teams
- Admin — this group has access to all resources
- Data source edit — this group has access to edit data sources. These users should have access to your Managed Warehouse.
- Data source view — this group has access to view data source details. We recommend adding at least all report editors to this group
- Report edit — has access to edit reports. We recommend not having too many “cooks in the kitchen” here
- Report view — has access to view & use reports.